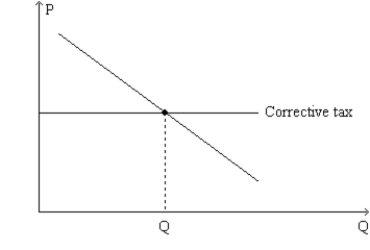
Figure 10-18. The graph represents a corrective tax to reduce pollution. On the axes, Q denotes the quantity of pollution and P represents the price of pollution. 
-Refer to Figure 10-18. The line labeled "Corrective tax" could accurately be re-labeled as
Definitions:
Infectious Diseases
Diseases caused by pathogenic microorganisms, such as bacteria, viruses, parasites or fungi; these diseases can be spread, directly or indirectly, from one person to another.
GAAS Auditing
Standards that guide the conduct of audits on the financial statements of companies, known as Generally Accepted Auditing Standards.
Adverse Opinion
An auditor’s opinion that states that deviations from generally accepted accounting principles are so serious that an unqualified opinion is impossible and a qualified opinion is not justified.
GAAP
Generally Accepted Accounting Principles; the standard framework of guidelines for financial accounting used in any given jurisdiction.
Q126: Refer to Figure 10-3. At the private
Q184: Fornelli, Inc. can produce 100 units of
Q214: When negative externalities are present in a
Q225: Refer to Figure 10-9, Panel (b) and
Q236: Dick owns a dog whose barking annoys
Q252: Refer to Figure 10-16. This graph shows
Q313: The free-rider problem<br>A)forces the supply of a
Q339: Knowledge that is patented is a<br>A)public good,
Q409: Suppose that smoking creates a negative externality.
Q539: A benevolent social planner would prefer that