Multiple Choice
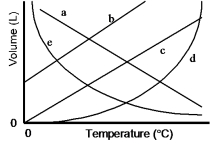
Which of the lines on the figure below is the best representation of the relationship between the volume of a gas and its Celsius temperature, other factors remaining constant? 
Definitions:
Related Questions
Q3: It is believed that two carbon-12 nuclei
Q5: One mole of O<sub>2</sub> has a mass
Q10: Which of the following isotopes is most
Q39: The ionization energy is the energy
Q46: Which one of the following properties is
Q57: Metallic behavior is generally associated with<br>A) elements
Q62: Calculate the molarity of a 23.55-mL solution
Q66: Which one of the following is
Q67: A sample of propane, a component of
Q81: A) State the requirement for two molecules