Multiple Choice
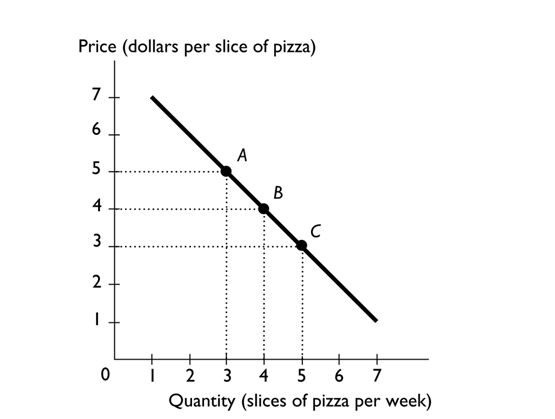
The above figure shows the relationship between the price of a slice of pizza and how many slices of pizza Ricardo buys in a week. Between points A and B, the slope of the line is-------------------- the slope of the line between points B and C.
Definitions:
Related Questions
Q22: Refer to Figure 8-7. What is the
Q26: The following information pertains to Stark Ltd.:
Q29: Assuming all other things are the same,
Q35: The Barnes Company manufactures two products. Information
Q59: assuming there are no capital gains, a
Q61: Barbara is willing to loan $10,000 if
Q71: Which type of graph is most useful
Q125: Which of the following statements is a
Q138: In the loanable funds market, a shortage
Q164: Which of the following is NOT a