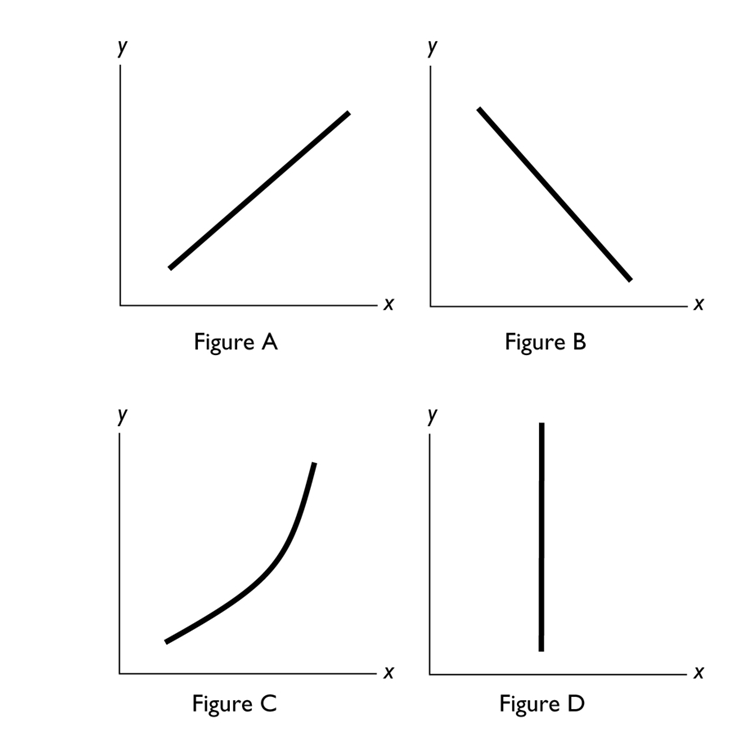
In the diagram above, which figure(s) show(s) an inverse relationship between the variables?
Definitions:
Determinants of Market Supply
Factors that influence the quantity of a good or service that producers are willing and able to sell at a given price, such as production costs, technology, and number of sellers.
Law of Demand
The economic principle that, all else being equal, there is an inverse relationship between the price of a good and the quantity demanded.
Other-Things-Equal Assumption
The assumption that factors other than those being considered are held constant. Also known as the ceteris paribus assumption.
Supply
The total amount of a specific good or service that is available to consumers at current prices.
Q22: Which of the following is <u>NOT</u> one
Q38: Which of the following costs is NOT
Q44: Refer to Figure 6-3. What is the
Q47: As the nominal interest rate increases, the
Q48: Refer to Figure 8-1. What is the
Q67: <br><br>The above figure shows the production possibility
Q91: <br>The figure above show Liz's and Joe's
Q97: <img src="https://d2lvgg3v3hfg70.cloudfront.net/TB2787/.jpg" alt=" In the figure
Q124: When the nominal interest rate increases, the<br>A)demand
Q165: The cost of a one-unit increase in