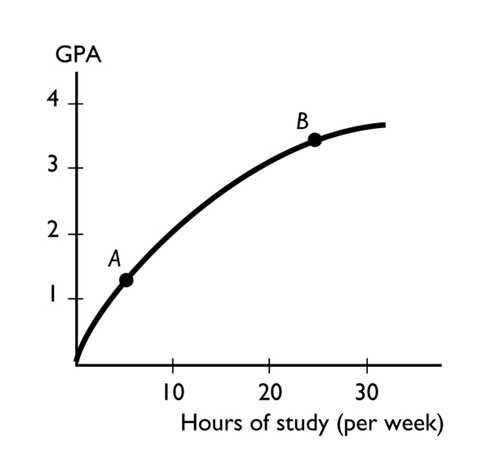
The figure above shows the relationship between the time a student spends studying and the student's GPA that semester. The slope of the relationship at point A -------------------- the slope at point B.
Definitions:
Unattainable
Refers to goals, objects, or conditions that cannot be achieved or reached, often due to existing limitations.
Full Employment
A situation in an economy in which all who are willing and able to work at prevailing wage rates are employed.
Production Possibility Frontier
A graphical representation showing the maximum combination of goods and services that can be produced with available resources and technology.
Resources Scarcity
The economic condition of limited natural resources available to meet the unlimited wants and needs of people.
Q3: Information about three joint products follows: <img
Q15: Conversion costs do NOT include<br>A) direct materials.<br>B)
Q17: In a cost-volume-profit graph, the slope of
Q34: Using absorption costing, a company can _
Q41: If there is no Ricardo-Barro effect,
Q87: Consider a production possibility frontier with jeans
Q89: The equation of exchange shows that<br>A)P =
Q96: If the currency drain ratio is zero,
Q125: Which of the following statements is a
Q137: In economics, cost is measured as<sub>--------------------</sub> ,