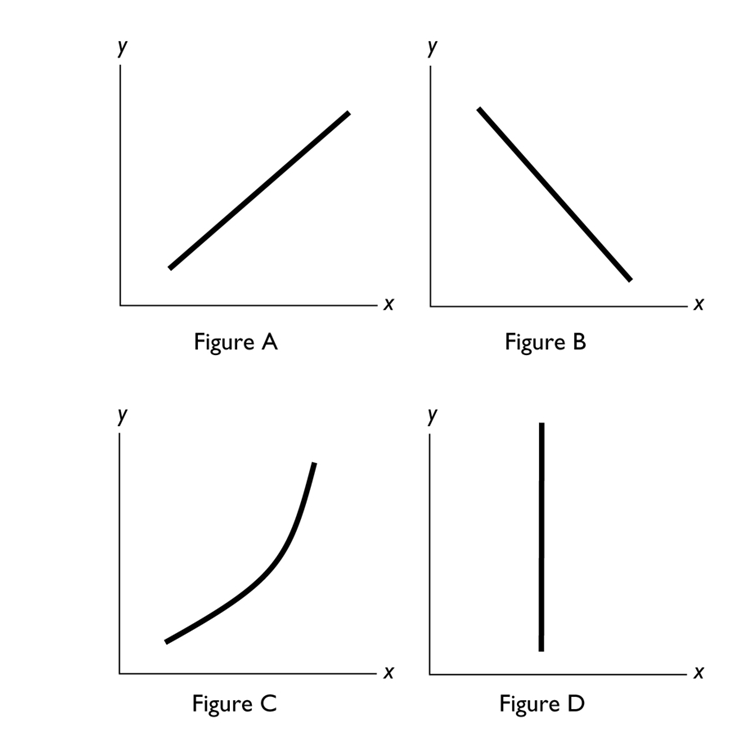
In the diagram above, which figure(s) show(s) an inverse relationship between the variables?
Definitions:
Debt to Equity Ratio
A financial ratio that compares the total liabilities of a company to the total amount of shareholder equity.
Working Capital
The difference between a company's current assets and current liabilities, indicating the liquidity position of the business.
Long Term Liabilities
Obligations or debts that are due to be paid after one year or more, such as bonds payable or long-term loans.
Price-Earnings Ratio
A financial ratio that measures a company's current share price relative to its per-share earnings, used for valuing companies and comparing their financial health.
Q4: Eastwood Company has the following information for
Q14: Your economics professor offers 10 points extra
Q18: Suppose that the equilibrium nominal interest rate
Q23: Laguna Company had a net income of
Q27: If there is increasing opportunity cost, then
Q56: In a profit-volume graph, the slope of
Q61: Given these curves, there is a
Q92: For country North, the opportunity cost incurred
Q117: <img src="https://d2lvgg3v3hfg70.cloudfront.net/TB2787/.jpg" alt=" In the
Q192: When Gabriel made a rational choice to