Figure 9-18.On the diagram below,Q represents the quantity of peaches and P represents the price of peaches.The domestic country is Isoland. 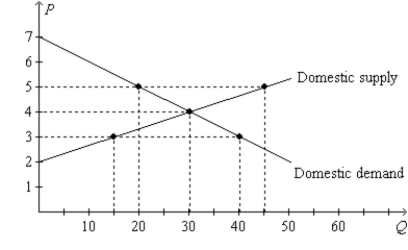
-Refer to Figure 9-18.Suppose Isoland changes from a no-trade policy to a policy that allows international trade.If the world price of peaches is $3,then the policy change results in a
Definitions:
Hard-sell Approach
A sales strategy that uses aggressive tactics and pressure to convince customers to buy a product or service.
Potential Problems
Issues or challenges that may arise in the future or under certain conditions.
Inductive Reasoning
A logical process in which multiple premises, all believed true or found true most of the time, are combined to obtain a specific conclusion.
Generalization
A broad statement or concept obtained by inference from specific cases.
Q7: Refer to Table 8-1. Suppose the government
Q36: Refer to figure 9-26. Prior to opening
Q53: When a country allows trade and becomes
Q102: Suppose that the market for product X
Q126: Refer to Figure 9-23. With free trade,
Q214: Taxes drive a wedge into the market
Q274: The optimal tax is difficult to determine
Q355: Domestic consumers gain and domestic producers lose
Q444: Refer to Figure 9-2. If this country
Q466: When a tax on a good is