Multiple Choice
Figure 8-7
The vertical distance between points A and B represents a tax in the market. 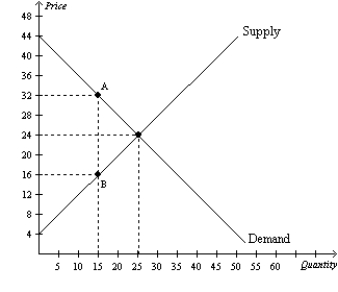
-Refer to Figure 8-7.The deadweight loss associated with this tax amounts to
Definitions:
Related Questions
Q11: The supply curve for whiskey is the
Q12: In terms of gains from trade, why
Q64: Refer to Figure 8-12. Suppose a $3
Q88: Refer to Figure 7-11. If the supply
Q147: Assume, for Vietnam, that the domestic price
Q237: Producer surplus is the amount a seller
Q268: Deadweight loss measures the loss<br>A)in a market
Q405: Refer to Figure 9-22. Suppose the government
Q463: Refer to Figure 7-23. The efficient price-quantity
Q477: Refer to Figure 8-29. As the size