Multiple Choice
Figure 4-24
The diagram below pertains to the demand for turkey in the United States. 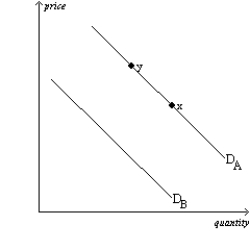
-Refer to Figure 4-24.All else equal,buyers expecting turkey to be more expensive in the future would cause a current move from
Definitions:
Related Questions
Q38: Suppose a country has had a high
Q68: Heath's income elasticity of demand for concerts
Q95: A market supply curve shows<br>A)the total quantity
Q119: Double taxation means that both<br>A)wage income and
Q204: For which of the following types of
Q378: Refer to Figure 4-27. Panel (d) shows
Q404: When Mario's income decreases, he buys more
Q410: Refer to Figure 4-13. If Producer A
Q551: A city wants to raise revenues to
Q581: The market supply curve<br>A)is found by vertically