Figure 4-5 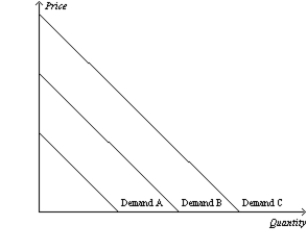
-Refer to Figure 4-5.Which of the following would cause the demand curve to shift from Demand A to Demand B in the market for golf balls in the United States?
Definitions:
Big Data
A term that describes both the growth in information that inundates businesses each day and the complex tools used to analyze the data and derive meaningful insights.
Predictive Modeling
Analysis that uses statistical techniques and algorithms based on patterns of past behavior to predict future unknown events, such as future buying behavior.
Information Overload
A condition in which the volume of information received exceeds an individual's ability to process it, often leading to decision-making paralysis.
Mobile Marketing
Marketing activities performed through mobile devices, such as smartphones and tablets, including app-based marketing, SMS marketing, and mobile web marketing.
Q147: Provide an example of how current expenditures
Q248: Suppose that demand for a good increases
Q259: An increase in inflation expectations shifts the
Q289: If businesses become more pessimistic about the
Q299: A permanent reduction in inflation would<br>A)permanently reduce
Q318: If corn is an input into the
Q321: What component of GDP is particularly volatile
Q354: Refer to Figure 4-9. The graphs show
Q415: A decrease in the price of a
Q422: Refer to Figure 4-24. All else equal,