Multiple Choice
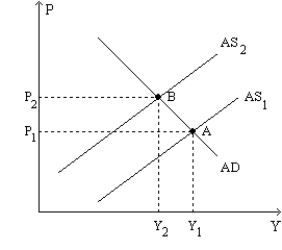
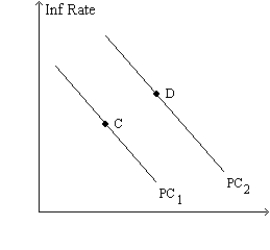
Figure 35-9.The left-hand graph shows a short-run aggregate-supply (SRAS) curve and two aggregate-demand (AD) curves.On the right-hand diagram,"Inf Rate" means "Inflation Rate." 

-Refer to Figure 35-9.What is measured along the horizontal axis of the right-hand graph?
Definitions:
Related Questions
Q52: What is the value of the multiplier
Q72: The idea that the long-run Phillips curve
Q99: Refer to Figure 34-13. The economy is
Q140: The misery index is supposed to measure
Q153: _ are changes in fiscal policy that
Q177: The additional shifts in aggregate demand that
Q205: Some economists, called supply-siders, argue that changes
Q494: To offset increased pessimism by households, the
Q499: After an oil price shock, which of
Q511: Refer to figure 35-8. Suppose the economy