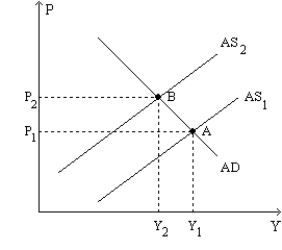
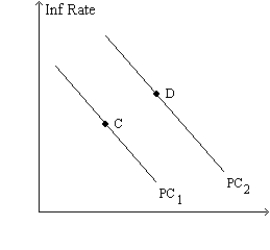
Figure 35-9.The left-hand graph shows a short-run aggregate-supply (SRAS) curve and two aggregate-demand (AD) curves.On the right-hand diagram,"Inf Rate" means "Inflation Rate." 

-Refer to Figure 35-9.A significant increase in the world price of oil could explain
Definitions:
Racial Discrimination
Unfair treatment of individuals based on their race, which can manifest in societal, economic, or personal interactions.
Economics of Sport
The study of how economic factors influence sports, including the financial aspects of sports teams, events, and the impact on local and global economies.
Stereotyping
The act of assigning a fixed, generalized attribute or assumption to individuals based solely on their membership in a particular social or demographic group.
Social Categorization
The process of sorting people into groups on the basis of characteristics they have in common (e.g., race, gender, age, religion, sexual orientation).
Q85: The Fed raised interest rates in 2004
Q93: Refer to Figure 35-6. Curve 2 is
Q96: One way to express the classical idea
Q232: Refer to Figure 34-10. Suppose the multiplier
Q244: If a central bank increases the money
Q277: The economy is in long-run equilibrium when
Q306: Refer to Figure 35-1. What is measured
Q321: If taxes rise, then aggregate demand shifts<br>A)right,
Q339: If the unemployment rate is below the
Q347: Describe the process in the money market