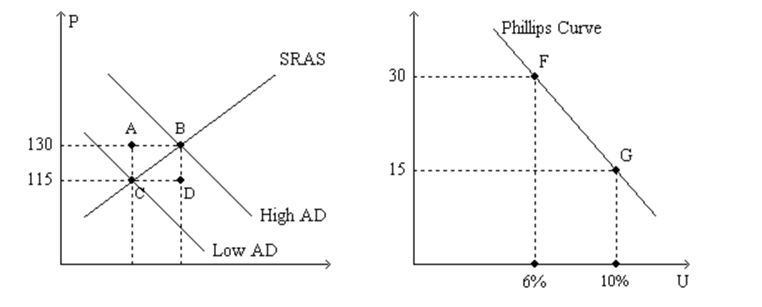
Figure 35-1.The left-hand graph shows a short-run aggregate-supply (SRAS) curve and two aggregate-demand (AD) curves.On the right-hand diagram,U represents the unemployment rate. 
-Refer to Figure 35-1.Suppose points F and G on the right-hand graph represent two possible outcomes for an imaginary economy in the year 2012,and those two points correspond to points B and C,respectively,on the left-hand graph.Also suppose we know that the price index equaled 120 in 2011.Then the numbers 115 and 130 on the vertical axis of the left-hand graph would have to be replaced by
Definitions:
Products Liability Action
A legal claim against a manufacturer or seller for producing or selling a defective product causing injury or damage.
MacPherson Case
A landmark legal case that established the principle of duty of care in negligence, making manufacturers liable for harm caused by defective products.
Foreseeable Plaintiff
A person who is reasonably expected to be affected by a defendant's actions, thus entitled to protection under the duty of care in negligence law.
Duty of Care
A legal obligation imposed on individuals or organizations to adhere to a standard of reasonable care while performing any acts that could foreseeably harm others.
Q10: If the government faced a balanced budget
Q14: If the sacrifice ratio is 2, reducing
Q57: Other things equal, in the short run
Q77: In the short run, policy that changes
Q95: Friedman and Phelps believed that the natural
Q135: Refer to Scenario 34-2. For this economy,
Q184: Which of the following policy alternatives would
Q229: Natural rate of unemployment - a ×
Q275: Suppose foreigners find U.S. goods and services
Q483: For a given short-run Phillips curve, if