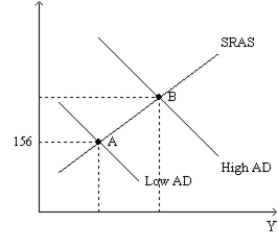
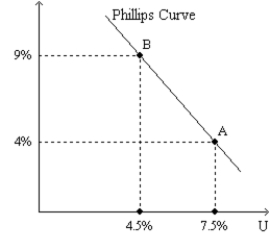
Figure 35-3.The left-hand graph shows a short-run aggregate-supply (SRAS) curve and two aggregate-demand (AD) curves.On the left-hand diagram,Y represents output and on the right-hand diagram,U represents the unemployment rate. 

-Refer to Figure 35-3.Assume the figure depicts possible outcomes for the year 2018.In 2018,the economy is at point A on the left-hand graph,which corresponds to point A on the right-hand graph.The price level in the year 2017 was
Definitions:
Age of Majority
The legally defined age at which an individual is considered an adult and is responsible for his or her actions and decisions.
Law of Infants
Legal provisions and protections specifically related to the rights and well-being of minors.
Torts
Legal wrongs committed against a person or property, excluding breach of contract, for which the law provides a remedy.
Guarantees
Promises or assurances, usually in writing, that certain conditions will be fulfilled, often relating to the quality or durability of a product or service.
Q50: Which of the following shifts aggregate demand
Q77: In the short run, an increase in
Q80: The short-run Phillips curve shows the combinations
Q267: According to liquidity preference theory,<br>A)an increase in
Q286: Refer to Figure 35-6. If the economy
Q403: The lag problem associated with fiscal policy
Q418: Which of the following are effects of
Q433: Refer to Figure 35-7. Starting from C
Q490: Explain the logic according to liquidity preference
Q521: A rightward shift of the short-run aggregate-supply