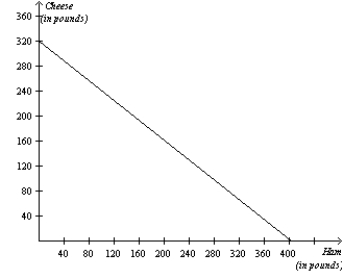
Figure 3-23
The graph below represents the various combinations of ham and cheese (in pounds) that the nation of Bonovia could produce in a given month. 
-Refer to Figure 3-23.For Bonovia,what is the opportunity cost of a pound of cheese?
Definitions:
Marketable Securities
Financial instruments that can be quickly converted into cash at market value, including stocks and bonds.
Raw Materials
Basic materials that are used in the production process of manufacturing goods, including metals, oil, grains, and other commodities.
Cash Discounts
Incentives offered by sellers to buyers for paying their invoices early, typically a percentage reduction in the invoice amount.
Cash Budget
A forecast of cash receipts and disbursements for the next planning period.
Q153: Refer to Scenario 29-2. Assuming the only
Q161: Refer to Figure 3-6. If the production
Q277: Refer to Table 3-34. For which good(s)
Q287: Refer to Figure 3-13. Suppose Madagascar is
Q309: Which tool of monetary policy does the
Q329: Refer to Table 3-17. If the production
Q410: Adam Smith developed the theory of comparative
Q478: Travis can mow a lawn in two
Q493: To decrease the money supply, the Fed
Q505: Reserves increase if the Federal Reserve<br>A)raises the