Figure 21-30 The graph shows two budget constraints for a consumer. 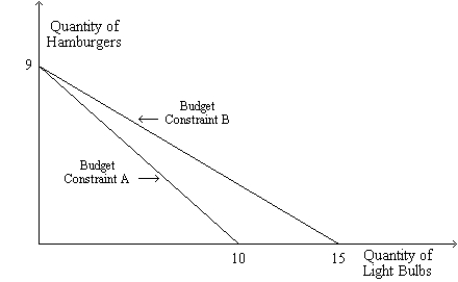
-Refer to Figure 21-30. Suppose the price of a light bulb is $3 and Budget Constraint B applies. What is the consumer's income? What is the price of a hamburger?
Definitions:
Long-run Equilibrium
A state in which all factors of production and costs are variable, and all economic actors have fully adjusted to any economic changes, leading to a no-profit, no-loss scenario.
Monopolistically Competitive
A market structure characterized by many firms selling products that are similar but not identical, allowing for some degree of market power and differentiated competition.
Zero Profit
A situation where a firm's total revenues exactly equal its total costs, resulting in no net gain or loss.
Short-run Equilibrium
A state in a market where supply equals demand within a short-term period, leading to a stable price level temporarily.
Q8: Suppose a consumer spends her income on
Q43: Refer to Scenario 21-4. If Frank uses
Q78: Refer to Figure 21-32. From the figure
Q117: Refer to Figure 21-9. If the consumer
Q133: A Giffen good is a good for
Q146: Samantha is maximizing total utility while consuming
Q146: Which of the following statements is not
Q307: Evidence suggests that, in the real world,
Q415: Energy drinks and granola bars are normal
Q503: Refer to Figure 21-5. Assume that a