Figure 21-4
In each case, the budget constraint moves from BC-1 to BC-2. 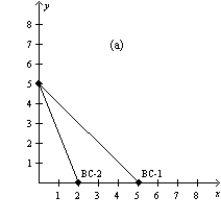
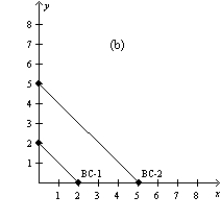
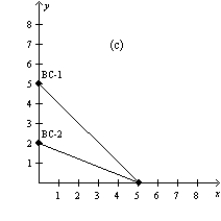
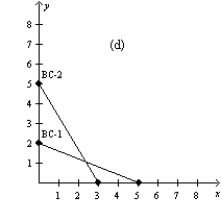
-Refer to Figure 21-4. Which of the graphs in the figure could reflect a simultaneous increase in the price of good X and decrease in the price of good Y?
Definitions:
Ounce of Chocolate
A unit of measure representing the weight of chocolate, commonly used in purchasing or consuming chocolate.
Price-quantity Schedules
Charts or tables that show the relationship between the prices of goods and services and the quantities supplied or demanded at those prices.
Demand
A schedule or curve that shows the various amounts of a product that consumers are willing and able to purchase at each of a series of possible prices during a specified period of time.
Consumer Income
The total earnings of a consumer, influencing their purchasing power and ability to buy goods and services.
Q38: Since about 1970 in the U.S.,<br>A)decreases in
Q115: The distribution of income for Inequalia is
Q156: Refer to Scenario 20-5. This negative income
Q163: Asymmetric information, political economy, and behavioral economics<br>A)are
Q210: The United States has greater income<br>A)disparity than
Q217: According to the maximin criterion, income should
Q321: Suppose the government used the following formula
Q522: In the work-leisure model, suppose consumption and
Q557: Hold the prices of goods, as well
Q566: Refer to Figure 21-5. In graph (b),