Figure 1
b.
Figure 2
c.
Figure 3
d.
Figure 4
ANSWER:
d
DIFFICULTY:
Moderate
LEARNING OBJECTIVES:
ECON.MANK.174 - Given a graph of the production function and input costs, derive the firm's total-cost curve.
TOPICS:
Producer theory
Production function
KEYWORDS:
BLOOM'S: Comprehension
CUSTOM ID:
178.13.3 - MC - MANK08
Figure 13-8 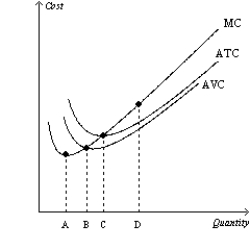
-Refer to Figure 13-8. Which of the following statements is correct?
Definitions:
Dealer
An individual or firm involved in the business of buying and selling securities for their own account or for others.
Agency Costs
Costs arising from the conflict of interest between a principal (such as a shareholder) and an agent (such as a company manager), including monitoring and contracting costs.
Moral Hazard
A situation in economics where one party can take risks because they do not bear the full consequences of their actions, often due to asymmetric information or a disconnect between actions and consequences.
Information Gathering
The process of collecting data and information from various sources to make informed decisions or understand situations better.
Q32: The average-fixed-cost curve is always declining. How
Q93: Although economists and accountants treat many costs
Q136: Refer to Table 13-7. What is the
Q216: In the long run a company that
Q222: Suppose that a firm operating in perfectly
Q356: The benefits principle of taxation can be
Q476: Because the goods offered for sale in
Q501: Over the past 100 years, as the
Q585: A firm that has little ability to
Q636: Refer to Scenario 13-2. Suppose Chelsea purchases