The following table shows the unit shipping cost between cities, the supply at each source city, and the demand at each destination city. The Management Scientist solution is shown. Report the optimal solution. 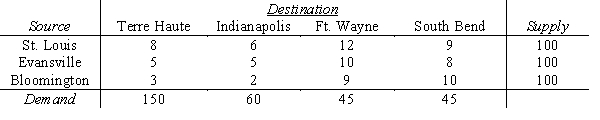
TRANSPORTATION PROBLEM
*****************************
OBJECTIVE: MINIMIZATION
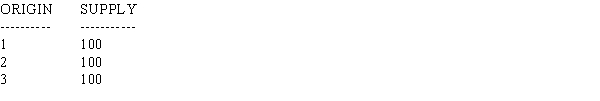
SUMMARY OF ORIGIN SUPPLIES
******************************** 
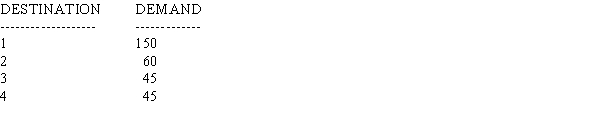
SUMMARY OF DESTINATION DEMANDS
*************************************** 
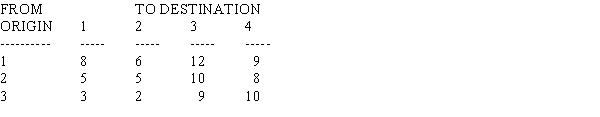
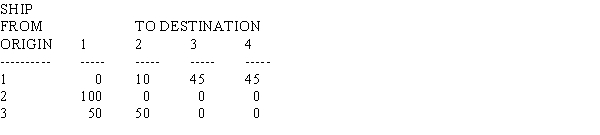
SUMMARY OF UNIT COST OR REVENUE DATA
********************************************* 
OPTIMAL TRANSPORTATION SCHEDULE
**************************************** 
TOTAL TRANSPORTATION COST OR REVENUE IS 1755
Definitions:
Days In Inventory
Days in inventory is a financial metric that measures the average number of days a company holds inventory before selling it, indicating the efficiency of inventory management.
Current Ratio
A liquidity ratio that measures a company's ability to pay short-term obligations or those due within one year.
Dividend Yield
A metric indicating the annual dividends a firm distributes in relation to its share price.
Asset Turnover
A financial ratio indicating how efficiently a company uses its assets to generate revenue.
Q8: For a two-person, zero-sum, mixed-strategy game, it
Q17: If the optimal solution to the LP
Q23: The function f (X, Y) = X
Q26: Comfort Plus Inc. (CPI) manufactures a standard
Q30: What is the Principle of Optimality, and
Q33: If the simplex tableau is from a
Q44: For the project represented below, determine the
Q52: Canning Transport is to move goods from
Q61: The primary purpose of financial reporting is
Q78: The Conceptual Framework includes two "fundamental qualitative