Use the following information to answer the next questions.
The following graph depicts a market where a tax has been imposed. Pe was the equilibrium price before the tax was imposed, and Qe was the equilibrium quantity. After the tax, PC is the price that consumers pay, and PS is the price that producers receive. QT units are sold after the tax is imposed. NOTE: The areas B and C are rectangles that are divided by the supply curve ST. Include both sections of those rectangles when choosing your answers.
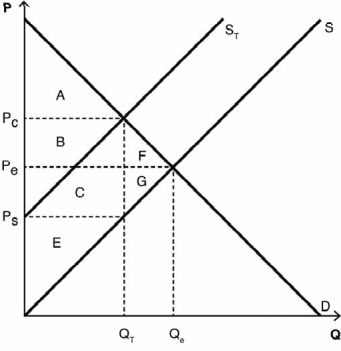
-Which areas represent consumer surplus before the tax is imposed?
Definitions:
Controllable Factor
Something that affects demand that a company can change. Examples include price, advertising, warranties, and product quality.
Delivery Rates
The percentage or success rate at which goods or services are successfully delivered to the recipient within the promised time frame.
Pizza
A popular dish of Italian origin consisting of a flat, round base of dough topped with tomatoes, cheese, and various other ingredients, baked in an oven.
Laptop Memory Chips
Components in laptops that store data temporarily to increase the device's processing speed and efficiency.
Q10: The deadweight loss from a tax is
Q29: If the price and quantity for an
Q32: Let's say that Alisha has a friend
Q35: Workers who lose their jobs because of
Q53: Higher input costs<br>A) reduce profits.<br>B) increase profits.<br>C)
Q56: The economists at JET Consulting consider Campbell's
Q80: Trade-offs occur in all of the following
Q102: Which country has had a recent surge
Q131: Someone has a comparative advantage in producing
Q137: What was the inflation rate between the