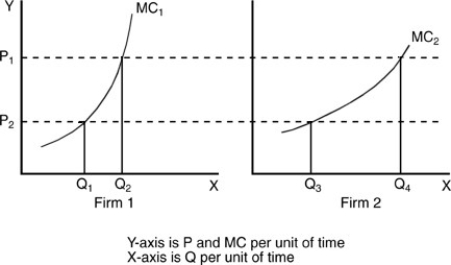
-In the above figure, assuming Firm 1 and Firm 2 are the sole producers in the industry, the industry quantity supplied at price P2 is equal to
Definitions:
Losses
The negative financial result from business activities when costs exceed revenues.
Demand
The total quantity of a good or service that consumers are willing and able to purchase at various prices during a specified period.
Supply
The total amount of a product or service that is available to consumers.
Rents
Payments made for the use of property or land; in economics, it also refers to earnings in excess of the minimum amount needed to keep a factor of production in its current use.
Q113: If the average product of 20 workers
Q139: Refer to the above table. At an
Q217: The perfectly competitive seller's short-run supply curve
Q282: Refer to the above figure. Profits for
Q303: A basic distinction between the long run
Q311: According to the above table, what is
Q342: According to the above figure, the profit-maximizing
Q358: A production function is a(n)<br>A)cost relationship.<br>B)economic relationship.<br>C)accounting
Q379: What is the short-run shutdown price? Using
Q389: Refer to the above figure. In order