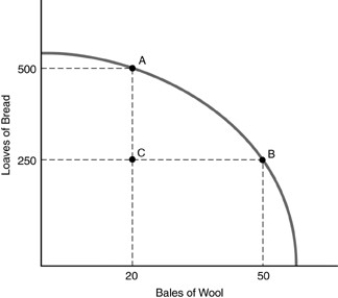
-Refer to the above figure. Which one of the following statements is true with regard to the economy depicted in the graph?
Definitions:
Lorenz Curves
Graphical representations that show the distribution of income or wealth among individuals or households in a given economy.
Share Of Total Income
The proportion of total national or group income that is earned by individuals or segments of a population, often used to analyze income distribution and inequality.
Income Inequality
The unequal distribution of income within a population, often measured by various statistical means like the Gini coefficient.
Earnings Received From Wealth
Income generated from assets owned, such as dividends from stocks, interest on bonds, or rent from property.
Q4: A point inside a society's production possibilities
Q125: Refer to the above figure. If the
Q183: When a country specializes and trades with
Q200: Capital goods<br>A)are a special type of consumption
Q208: Refer to the above figure. A farmer
Q258: Refer to the above figure. Assume that
Q351: Which factor of production includes water?<br>A)physical capital<br>B)human
Q366: Total revenues reach a maximum when<br>A)demand is
Q422: Refer to the above figure. Which point
Q444: To derive the demand curve from the