Multiple Choice
The following figure shows Arrhenius plots for four different reactions.Which reaction has the lowest frequency factor? 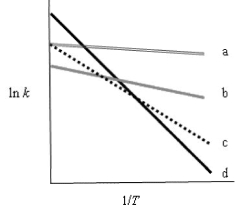
Definitions:
Related Questions
Q9: Which of the following must be true
Q33: The rate of disappearance of HI
Q52: A proposed mechanism for the reduction
Q58: In equilibrium expressions, the concentrations of pure
Q59: Several groups of general chemistry lab
Q73: An electrochemical cell has both a silver
Q106: You wish to use precipitation to separate
Q110: Given the following data, determine the
Q159: A balloon is filled with 3.00 L
Q162: Given the following data, determine the