Multiple Choice
The figure below shows the graph of z = f(x, y) and its intersection with various planes.(The x and y-axes have the same scale.) What is the sign of ? 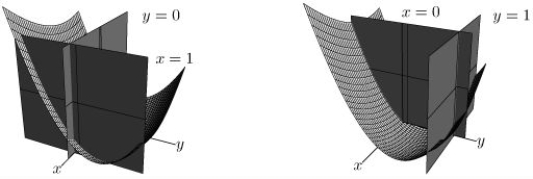
Definitions:
Related Questions
Q5: Let <span class="ql-formula" data-value="f (
Q5: Let <span class="ql-formula" data-value="\vec{F}=-3 y
Q19: Recognize <span class="ql-formula" data-value="5-\frac{5^{3}}{3 !}+\frac{5^{5}}{5
Q22: Let <span class="ql-formula" data-value="\vec{F}=81 y
Q33: The quantity z can be expressed
Q35: Consider the figure shown below. <img
Q43: Let ABCDEF be a regular hexagon.Express
Q70: What is the interval of convergence
Q89: Let <span class="ql-formula" data-value="z =
Q95: Given the points P = (1, 2,