Examlex

Solved

SCENARIO 12-11
a Computer Software Developer Would Like to Use

question 15

Short Answer

SCENARIO 12-11
A computer software developer would like to use the number of downloads (in thousands) for the trial version of his new shareware to predict the amount of revenue (in thousands of dollars) he can make on the full version of the new shareware.Following is the output from a simple linear regression
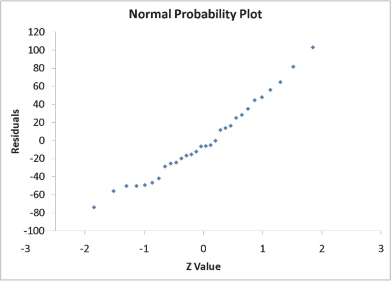
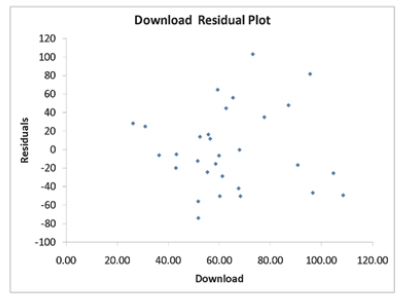
along with the residual plot and normal probability plot obtained from a data set of 30 different sharewares that he has developed:

 SCENARIO 12-11 A computer software developer would like to use the number of downloads (in thousands) for the trial version of his new shareware to predict the amount of revenue (in thousands of dollars) he can make on the full version of the new shareware.Following is the output from a simple linear regression along with the residual plot and normal probability plot obtained from a data set of 30 different sharewares that he has developed:     \begin{array}{lr} {\text { Regression Statistics }} \\ \hline \text { Multiple R } & 0.8691 \\ \hline \text { R Square } & 0.7554 \\ \hline \text { Adjusted R Square } & 0.7467 \\ \hline \text { Standard Error } & 44.4765 \\ \hline \text { Observations } & 30.0000 \\ \hline \end{array}    \text { ANOVA }    \begin{array}{|l|r|r|r|r|r|} \hline &\text { df } & \text { SS } & \text { MS } & F & \text { Significance } F \\  \hline \text { Regression } & 1 & 171062.9193 & 171062.9193 & 86.4759 & 0.0000 \\ \hline \text { Residual } & 28 & 55388.4309 & 1978.1582 & & \\ \hline \text { Total } & 29 & 226451.3503 & & \\ \hline \end{array}          Simple Linear Regression 12-41   -Referring to Scenario 12-11, predict the revenue when the number of downloads is 30 thousand.  Regression Statistics  Multiple R 0.8691 R Square 0.7554 Adjusted R Square 0.7467 Standard Error 44.4765 Observations 30.0000\begin{array}{lr}{\text { Regression Statistics }} \\\hline \text { Multiple R } & 0.8691 \\\hline \text { R Square } & 0.7554 \\\hline \text { Adjusted R Square } & 0.7467 \\\hline \text { Standard Error } & 44.4765 \\\hline \text { Observations } & 30.0000 \\\hline\end{array}

 ANOVA \text { ANOVA }
 df  SS  MS F Significance F Regression 1171062.9193171062.919386.47590.0000 Residual 2855388.43091978.1582 Total 29226451.3503\begin{array}{|l|r|r|r|r|r|}\hline &\text { df } & \text { SS } & \text { MS } & F & \text { Significance } F \\ \hline \text { Regression } & 1 & 171062.9193 & 171062.9193 & 86.4759 & 0.0000 \\\hline \text { Residual } & 28 & 55388.4309 & 1978.1582 & & \\\hline \text { Total } & 29 & 226451.3503 & & \\\hline\end{array}


 SCENARIO 12-11 A computer software developer would like to use the number of downloads (in thousands) for the trial version of his new shareware to predict the amount of revenue (in thousands of dollars) he can make on the full version of the new shareware.Following is the output from a simple linear regression along with the residual plot and normal probability plot obtained from a data set of 30 different sharewares that he has developed:     \begin{array}{lr} {\text { Regression Statistics }} \\ \hline \text { Multiple R } & 0.8691 \\ \hline \text { R Square } & 0.7554 \\ \hline \text { Adjusted R Square } & 0.7467 \\ \hline \text { Standard Error } & 44.4765 \\ \hline \text { Observations } & 30.0000 \\ \hline \end{array}    \text { ANOVA }    \begin{array}{|l|r|r|r|r|r|} \hline &\text { df } & \text { SS } & \text { MS } & F & \text { Significance } F \\  \hline \text { Regression } & 1 & 171062.9193 & 171062.9193 & 86.4759 & 0.0000 \\ \hline \text { Residual } & 28 & 55388.4309 & 1978.1582 & & \\ \hline \text { Total } & 29 & 226451.3503 & & \\ \hline \end{array}          Simple Linear Regression 12-41   -Referring to Scenario 12-11, predict the revenue when the number of downloads is 30 thousand.

 SCENARIO 12-11 A computer software developer would like to use the number of downloads (in thousands) for the trial version of his new shareware to predict the amount of revenue (in thousands of dollars) he can make on the full version of the new shareware.Following is the output from a simple linear regression along with the residual plot and normal probability plot obtained from a data set of 30 different sharewares that he has developed:     \begin{array}{lr} {\text { Regression Statistics }} \\ \hline \text { Multiple R } & 0.8691 \\ \hline \text { R Square } & 0.7554 \\ \hline \text { Adjusted R Square } & 0.7467 \\ \hline \text { Standard Error } & 44.4765 \\ \hline \text { Observations } & 30.0000 \\ \hline \end{array}    \text { ANOVA }    \begin{array}{|l|r|r|r|r|r|} \hline &\text { df } & \text { SS } & \text { MS } & F & \text { Significance } F \\  \hline \text { Regression } & 1 & 171062.9193 & 171062.9193 & 86.4759 & 0.0000 \\ \hline \text { Residual } & 28 & 55388.4309 & 1978.1582 & & \\ \hline \text { Total } & 29 & 226451.3503 & & \\ \hline \end{array}          Simple Linear Regression 12-41   -Referring to Scenario 12-11, predict the revenue when the number of downloads is 30 thousand. Simple Linear Regression 12-41  SCENARIO 12-11 A computer software developer would like to use the number of downloads (in thousands) for the trial version of his new shareware to predict the amount of revenue (in thousands of dollars) he can make on the full version of the new shareware.Following is the output from a simple linear regression along with the residual plot and normal probability plot obtained from a data set of 30 different sharewares that he has developed:     \begin{array}{lr} {\text { Regression Statistics }} \\ \hline \text { Multiple R } & 0.8691 \\ \hline \text { R Square } & 0.7554 \\ \hline \text { Adjusted R Square } & 0.7467 \\ \hline \text { Standard Error } & 44.4765 \\ \hline \text { Observations } & 30.0000 \\ \hline \end{array}    \text { ANOVA }    \begin{array}{|l|r|r|r|r|r|} \hline &\text { df } & \text { SS } & \text { MS } & F & \text { Significance } F \\  \hline \text { Regression } & 1 & 171062.9193 & 171062.9193 & 86.4759 & 0.0000 \\ \hline \text { Residual } & 28 & 55388.4309 & 1978.1582 & & \\ \hline \text { Total } & 29 & 226451.3503 & & \\ \hline \end{array}          Simple Linear Regression 12-41   -Referring to Scenario 12-11, predict the revenue when the number of downloads is 30 thousand.
-Referring to Scenario 12-11, predict the revenue when the number of downloads is 30 thousand.


Definitions:

Perfectly Negatively Correlated

A relationship between two variables in which one variable increases as the other decreases with a correlation coefficient of -1.

Risk-free Portfolio

A portfolio consisting of investments that are considered to have zero risk, often associated with government securities.

Standard Deviation

A statistical measure of the dispersion or variability of a set of values, indicating how much the values differ from the mean.

Efficient Frontier

A concept in modern portfolio theory that represents a set of optimal portfolios offering the highest expected return for a defined level of risk.

Related Questions