Examlex

Solved

SCENARIO 12-11
a Computer Software Developer Would Like to Use

question 47

Multiple Choice

SCENARIO 12-11
A computer software developer would like to use the number of downloads (in thousands) for the trial version of his new shareware to predict the amount of revenue (in thousands of dollars) he can make on the full version of the new shareware.Following is the output from a simple linear regression
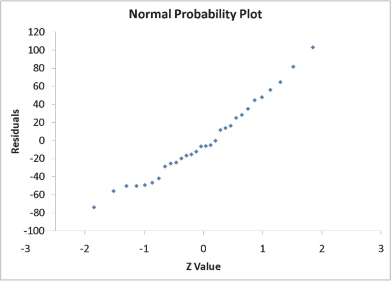
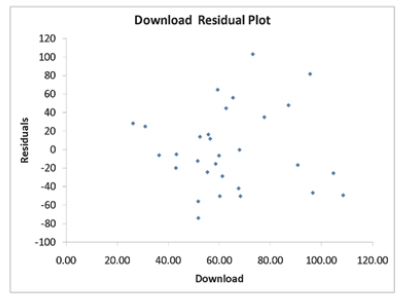
along with the residual plot and normal probability plot obtained from a data set of 30 different sharewares that he has developed:
 SCENARIO 12-11 A computer software developer would like to use the number of downloads (in thousands)  for the trial version of his new shareware to predict the amount of revenue (in thousands of dollars)  he can make on the full version of the new shareware.Following is the output from a simple linear regression along with the residual plot and normal probability plot obtained from a data set of 30 different sharewares that he has developed:     \begin{array}{lr} {\text { Regression Statistics }} \\ \hline \text { Multiple R } & 0.8691 \\ \hline \text { R Square } & 0.7554 \\ \hline \text { Adjusted R Square } & 0.7467 \\ \hline \text { Standard Error } & 44.4765 \\ \hline \text { Observations } & 30.0000 \\ \hline \end{array}    \text { ANOVA }    \begin{array}{|l|r|r|r|r|r|} \hline &\text { df } & \text { SS } & \text { MS } & F & \text { Significance } F \\  \hline \text { Regression } & 1 & 171062.9193 & 171062.9193 & 86.4759 & 0.0000 \\ \hline \text { Residual } & 28 & 55388.4309 & 1978.1582 & & \\ \hline \text { Total } & 29 & 226451.3503 & & \\ \hline \end{array}          Simple Linear Regression 12-41   -Referring to Scenario 12-11, which of the following is the correct interpretation for the coefficient of determination? A) 74.67% of the variation in revenue can be explained by the variation in the number of downloads. B) 75.54% of the variation in revenue can be explained by the variation in the number of downloads. C) 74.67% of the variation in the number of downloads can be explained by the variation in revenue. D) 75.54% of the variation in the number of downloads can be explained by the variation in revenue.  Regression Statistics  Multiple R 0.8691 R Square 0.7554 Adjusted R Square 0.7467 Standard Error 44.4765 Observations 30.0000\begin{array}{lr}{\text { Regression Statistics }} \\\hline \text { Multiple R } & 0.8691 \\\hline \text { R Square } & 0.7554 \\\hline \text { Adjusted R Square } & 0.7467 \\\hline \text { Standard Error } & 44.4765 \\\hline \text { Observations } & 30.0000 \\\hline\end{array}

 ANOVA \text { ANOVA }
 df  SS  MS F Significance F Regression 1171062.9193171062.919386.47590.0000 Residual 2855388.43091978.1582 Total 29226451.3503\begin{array}{|l|r|r|r|r|r|}\hline &\text { df } & \text { SS } & \text { MS } & F & \text { Significance } F \\ \hline \text { Regression } & 1 & 171062.9193 & 171062.9193 & 86.4759 & 0.0000 \\\hline \text { Residual } & 28 & 55388.4309 & 1978.1582 & & \\\hline \text { Total } & 29 & 226451.3503 & & \\\hline\end{array}


 SCENARIO 12-11 A computer software developer would like to use the number of downloads (in thousands)  for the trial version of his new shareware to predict the amount of revenue (in thousands of dollars)  he can make on the full version of the new shareware.Following is the output from a simple linear regression along with the residual plot and normal probability plot obtained from a data set of 30 different sharewares that he has developed:     \begin{array}{lr} {\text { Regression Statistics }} \\ \hline \text { Multiple R } & 0.8691 \\ \hline \text { R Square } & 0.7554 \\ \hline \text { Adjusted R Square } & 0.7467 \\ \hline \text { Standard Error } & 44.4765 \\ \hline \text { Observations } & 30.0000 \\ \hline \end{array}    \text { ANOVA }    \begin{array}{|l|r|r|r|r|r|} \hline &\text { df } & \text { SS } & \text { MS } & F & \text { Significance } F \\  \hline \text { Regression } & 1 & 171062.9193 & 171062.9193 & 86.4759 & 0.0000 \\ \hline \text { Residual } & 28 & 55388.4309 & 1978.1582 & & \\ \hline \text { Total } & 29 & 226451.3503 & & \\ \hline \end{array}          Simple Linear Regression 12-41   -Referring to Scenario 12-11, which of the following is the correct interpretation for the coefficient of determination? A) 74.67% of the variation in revenue can be explained by the variation in the number of downloads. B) 75.54% of the variation in revenue can be explained by the variation in the number of downloads. C) 74.67% of the variation in the number of downloads can be explained by the variation in revenue. D) 75.54% of the variation in the number of downloads can be explained by the variation in revenue.

 SCENARIO 12-11 A computer software developer would like to use the number of downloads (in thousands)  for the trial version of his new shareware to predict the amount of revenue (in thousands of dollars)  he can make on the full version of the new shareware.Following is the output from a simple linear regression along with the residual plot and normal probability plot obtained from a data set of 30 different sharewares that he has developed:     \begin{array}{lr} {\text { Regression Statistics }} \\ \hline \text { Multiple R } & 0.8691 \\ \hline \text { R Square } & 0.7554 \\ \hline \text { Adjusted R Square } & 0.7467 \\ \hline \text { Standard Error } & 44.4765 \\ \hline \text { Observations } & 30.0000 \\ \hline \end{array}    \text { ANOVA }    \begin{array}{|l|r|r|r|r|r|} \hline &\text { df } & \text { SS } & \text { MS } & F & \text { Significance } F \\  \hline \text { Regression } & 1 & 171062.9193 & 171062.9193 & 86.4759 & 0.0000 \\ \hline \text { Residual } & 28 & 55388.4309 & 1978.1582 & & \\ \hline \text { Total } & 29 & 226451.3503 & & \\ \hline \end{array}          Simple Linear Regression 12-41   -Referring to Scenario 12-11, which of the following is the correct interpretation for the coefficient of determination? A) 74.67% of the variation in revenue can be explained by the variation in the number of downloads. B) 75.54% of the variation in revenue can be explained by the variation in the number of downloads. C) 74.67% of the variation in the number of downloads can be explained by the variation in revenue. D) 75.54% of the variation in the number of downloads can be explained by the variation in revenue. Simple Linear Regression 12-41  SCENARIO 12-11 A computer software developer would like to use the number of downloads (in thousands)  for the trial version of his new shareware to predict the amount of revenue (in thousands of dollars)  he can make on the full version of the new shareware.Following is the output from a simple linear regression along with the residual plot and normal probability plot obtained from a data set of 30 different sharewares that he has developed:     \begin{array}{lr} {\text { Regression Statistics }} \\ \hline \text { Multiple R } & 0.8691 \\ \hline \text { R Square } & 0.7554 \\ \hline \text { Adjusted R Square } & 0.7467 \\ \hline \text { Standard Error } & 44.4765 \\ \hline \text { Observations } & 30.0000 \\ \hline \end{array}    \text { ANOVA }    \begin{array}{|l|r|r|r|r|r|} \hline &\text { df } & \text { SS } & \text { MS } & F & \text { Significance } F \\  \hline \text { Regression } & 1 & 171062.9193 & 171062.9193 & 86.4759 & 0.0000 \\ \hline \text { Residual } & 28 & 55388.4309 & 1978.1582 & & \\ \hline \text { Total } & 29 & 226451.3503 & & \\ \hline \end{array}          Simple Linear Regression 12-41   -Referring to Scenario 12-11, which of the following is the correct interpretation for the coefficient of determination? A) 74.67% of the variation in revenue can be explained by the variation in the number of downloads. B) 75.54% of the variation in revenue can be explained by the variation in the number of downloads. C) 74.67% of the variation in the number of downloads can be explained by the variation in revenue. D) 75.54% of the variation in the number of downloads can be explained by the variation in revenue.
-Referring to Scenario 12-11, which of the following is the correct interpretation for the coefficient of determination?

Understand the importance of combining influence tactics for successful outcomes and the potential results of such combinations.
Understand the various sources and types of power in organizations.
Analyze the effectiveness of different influence practices and tactics.
Recognize the role of superiors, peers, and subordinates in organizational influence.

Definitions:

Audience-centered

A communication strategy focused on the needs, interests, and expectations of the audience, aiming to engage them more effectively.

Paternalistic

An approach or management style where those in power restrict the freedom and responsibilities of those subordinate to them, presumably in their best interests.

Top-down Communication

An organizational communication flow where information and directives come from higher levels of the hierarchy to lower levels.

Ethically

Acting in a manner that is consistent with what is considered morally right or acceptable.

Related Questions