SCENARIO 12-12
The manager of the purchasing department of a large saving and loan organization would like to develop a model to predict the amount of time (measured in hours) it takes to record a loan
application.Data are collected from a sample of 30 days, and the number of applications recorded and completion time in hours is recorded.Below is the regression output: 12-46 Simple Linear Regression 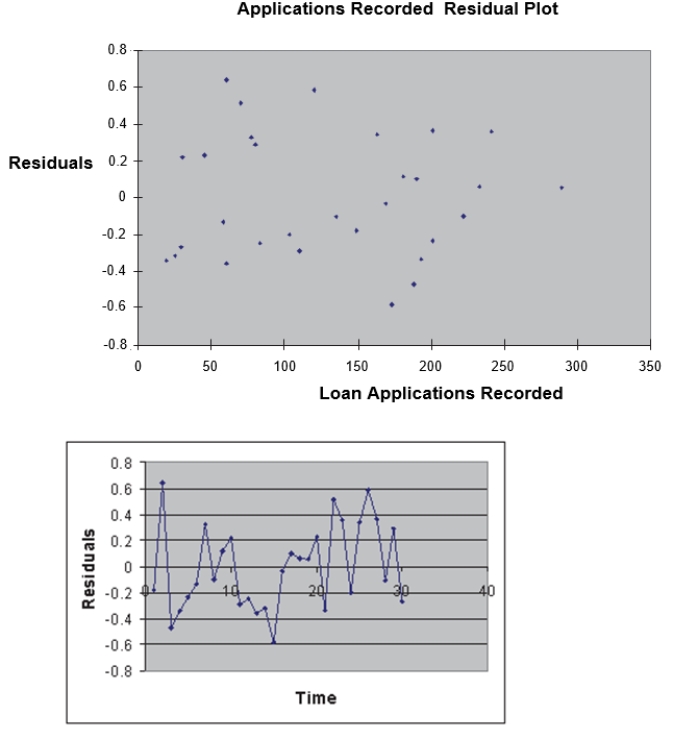 Simple Linear Regression 12-47
-Referring to Scenario 12-12, to test the claim that the mean amount of time depends positively on the number of loan applications recorded against the null hypothesis that the mean amount of time does not depend linearly on the number of invoices processed, the p-value of the test statistic is .
Definitions:
Group Decisions
The process by which two or more individuals agree upon a decision within a group setting, often requiring negotiation and compromise.
Consequential Theories
Ethical theories that determine the rightness or wrongness of actions based on their outcomes or results.
Rule-based Theories
Philosophical theories that emphasize the importance of following structured, predefined rules or guidelines to determine moral conduct or decision-making processes.
Character Theories
Theories that attempt to explain aspects of a person's character, often focusing on traits, motivations, and behaviors that define their personality.
Q14: Referring to Scenario 12-12, suppose we want
Q32: Referring to SCENARIO 14-7, the "complete" method
Q55: Referring to Scenario 12-6, which of the
Q57: Referring to Scenario 12-10, generate the residual
Q100: Referring to Scenario 12-6, what is
Q139: Referring to SCENARIO 13-18, which of the
Q170: Referring to Scenario 10-11, the value of
Q199: Referring to Scenario 12-4, suppose the managers
Q254: A plot of the residuals versus an
Q283: Referring to Scenario 10-13, suppose