SCENARIO 12-12
The manager of the purchasing department of a large saving and loan organization would like to develop a model to predict the amount of time (measured in hours) it takes to record a loan
application.Data are collected from a sample of 30 days, and the number of applications recorded and completion time in hours is recorded.Below is the regression output: 12-46 Simple Linear Regression 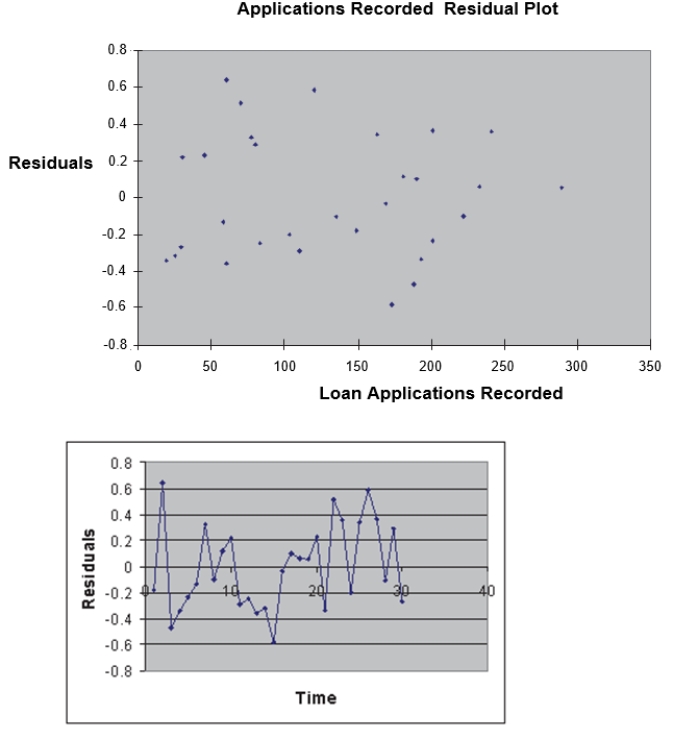 Simple Linear Regression 12-47
-Referring to Scenario 12-12, the value of the measured t-test statistic to test whether the amount of time depends linearly on the number of loan applications recorded is
Definitions:
Population Proportion
The ratio of a specific subgroup within a population to the entire population, typically expressed as a percentage.
Independent Random Samples
Samples selected from a population in such a way that each member has an equal chance of being chosen, with no dependence between the selections.
Standard Error
The standard deviation of the sampling distribution of a statistic, commonly used to estimate the accuracy of sample mean as a predictor of the population mean.
Pooled Estimate
Combining estimates from different populations to obtain a single estimate that is more accurate and has a higher power due to a larger sample size.
Q37: Referring to Scenario 12-6, what is the
Q73: Referring to SCENARIO 13-11, in terms
Q81: Referring to SCENARIO 13-15, the alternative
Q86: Referring to SCENARIO 10-4, the test is
Q88: Referring to Scenario 10-15, what is(are) the
Q146: If you are comparing the mean sales
Q149: Referring to SCENARIO 10-3, what are the
Q181: One of the morals of the red
Q210: Referring to Scenario 10-15, what is the
Q230: Referring to SCENARIO 10-4, the within-group variation