SCENARIO 2-4
A survey was conducted to determine how people rated the quality of programming available on television.Respondents were asked to rate the overall quality from 0 (no quality at all) to 100 (extremely good quality) .The stem-and-leaf display of the data is shown below.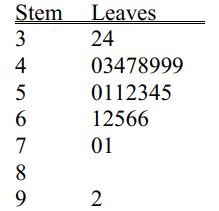
-Referring to Scenario 2-4,what percentage of the respondents rated overall television quality with a rating of 80 or above?
Definitions:
Pie Chart
A circular chart divided into sectors, each representing a proportion of the whole.
Pareto Chart
A bar graph where values are depicted in descending order of relative frequency, often used to highlight the most significant factors in a data set.
Stem-And-Leaf Plot
A graphical method of displaying quantitative data that splits each value into a "stem" (the leading digit or digits) and a "leaf" (the last digit).
Frequency Distribution
A summary of how often each value occurs in a data set, typically represented in a table or as a graph.
Q7: To gather opinions on the efficacy of
Q7: The LPN/LVN asks a patient who received
Q12: The nurse is caring for an 85-year-old
Q15: Referring to Scenario 3-2, the first quartile
Q59: When constructing charts, the following is plotted
Q101: <span class="ql-formula" data-value="\text { If } \mathrm
Q115: According to the Chebyshev rule, at least
Q116: Which of the following statements about the
Q156: A summary measure that is computed to
Q173: The number of calories contained in a