SCENARIO 14-1
The table below contains the sparklines for the rates of return (in percentage) for three different stocks from 2007 to 2013. 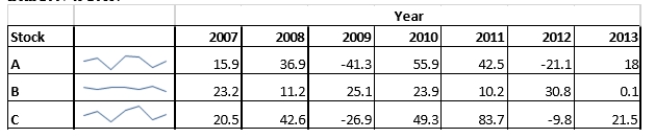
-Referring to SCENARIO 14-1, the sparklines enable you to draw conclusions on the historical trend of the rates of return of the three stocks.
Definitions:
Third-party App
Applications developed by entities other than the original manufacturer of the device or the owner of the operating system.
Historical Data
Archived data from the past used for reference or analysis to understand trends, patterns, or to make future predictions.
Consumer Demographics
The statistical aspects of consumers such as age, income, gender, and education, used by businesses to identify target markets.
Industry Trends
Patterns and shifts in the market or industry behavior that demonstrate the general direction in which something is developing or changing.
Q26: Scientists often depict their understanding of an
Q28: The age structure diagram of Canada suggests
Q32: If a nonrenewable resource such as oil
Q54: Referring to SCENARIO 13-17, there is sufficient
Q61: Referring to SCENARIO 13-3, the p-value for
Q83: Referring to Scenario 12-4, the total sum
Q166: The p chart is a control chart
Q185: Referring to SCENARIO 13-4, what annual income
Q221: Referring to SCENARIO 13-15, the null hypothesis
Q257: Referring to SCENARIO 13-3, to test whether