Refer to the following graph. 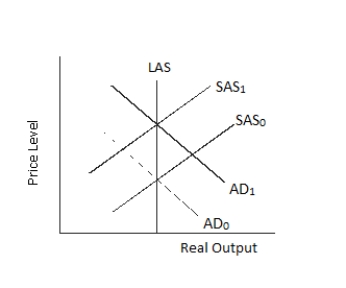 The massive increase in defense spending is best represented by the:
Definitions:
Rising Prices
A situation where the general level of prices for goods and services in an economy increases over a period of time.
Average Total Cost
The total cost of production divided by the quantity of output, encompassing both fixed and variable costs.
Average Variable Cost
The cost per unit of production that varies with the level of output, calculated by dividing the total variable costs by the number of units produced.
Variable Costs
Expenses that change in proportion to the activity of a business, such as costs for raw materials or production inputs.
Q24: If the required reserve ratio is 0.12,
Q29: Which of the following is not included
Q36: The text suggests that if economists had
Q43: The Rule of 72 implies that a
Q59: Refer to the table shown.From this table
Q62: In 1990 the UN placed trade sanctions
Q65: If a country's output and population are,
Q68: Asset management refers to:<br>A)a bank's handling of
Q82: The paradox of thrift will not arise
Q140: Money doesn't have to have any inherent