Multiple Choice
Refer to the graph below. 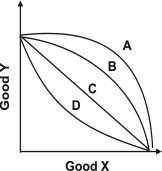 With which curve does the opportunity cost of an additional unit of good Y decrease as more units of good Y are produced?
Definitions:
Related Questions
Q1: In the United States globalization has played:<br>A)a
Q17: When comparative advantage is based on transferable
Q28: The discovery of a new source of
Q34: On average, globalization has:<br>A)been insignificant.<br>B)left Americans no
Q46: In the goods market:<br>A)households supply factors of
Q47: One reason economists distinguish between micro and
Q54: Countries gain from trade by producing:<br>A)the goods
Q60: The U.S.imposes substantial taxes on cigarettes but
Q73: Juan works at Texas Burgers in El
Q136: Governments can make trading easier and more