When children and adolescents are discharged from the hospital the parents may still provide substantial care, such as the insertion of a feeding tube through the nose and down the esophagus into the stomach. It is difficult for parents to know how far to insert the tube, especially with rapidly growing infants. It may be possible for parents to measure their child's height and from that calculate the appropriate insertion length using a regression equation. At a major children's hospital, children and adolescents' heights and esophageal lengths were measured and a regression analysis performed. The data from this analysis is summarized below: 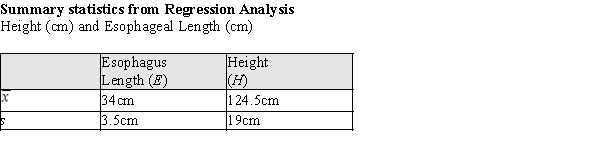 r = 0.995,
  = 11.476 + 0.181H
a)For a child with a height one standard deviation above the mean, what would be the predicted esophageal length?
b)What proportion of the variability in esophageal length is accounted for by the height of the children and adolescents?
c)From the information presented above, does it appear that the esophagus length can be accurately predicted from the height of young patients? Provide statistical evidence for your response.
Definitions:
Regression Equation
An equation derived in regression analysis that represents the expected value of the dependent variable as a function of one or more independent variables.
Variation
Variation refers to the distribution of data points or values within a dataset, indicating how much the data differ from each other.
Qualitative Variables
Variables that express descriptive, non-numerical qualities or categories.
Indicator Variables
Indicator variables, also known as dummy variables, are numeric variables used in statistical models to represent categorical data, with values typically 0 or 1 indicating the absence or presence of a characteristic.
Q1: A study investigating the relationship between the
Q22: A researcher investigates the effect of a
Q28: For any given data set, the median
Q30: The value of the residual plus <img
Q30: If the upper tail of a distribution
Q41: In a certain very large city, the
Q48: Refer to Exhibit 2-4.<br>Biologists speculate that the
Q50: A pie chart is most useful for
Q81: What is meant by the term" marketing
Q124: As the Industrial Revolution came to the