Exhibit 4-5
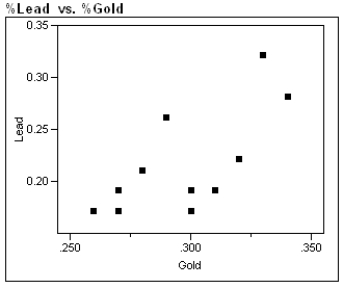
During the first 3 centuries AD, the Roman Empire produced coins in the Eastern provinces. Some historians argue that not all these coins were produced in local mints, and further that the mint of Rome struck some of them. Because the "style" of coins is difficult to analyze, the historians would like to use metallurgical analysis as one tool to identify the source mints of these coins. Investigators studied 11 coins known to have been produced by local mints in an attempt to identify a trace element profile for these coins, and have identified gold and lead as possible factors in identifying other coins as having been locally minted. The gold and lead content, measured as a % of weight of each coin, is given in the table, and a scatter plot of these data is presented below. 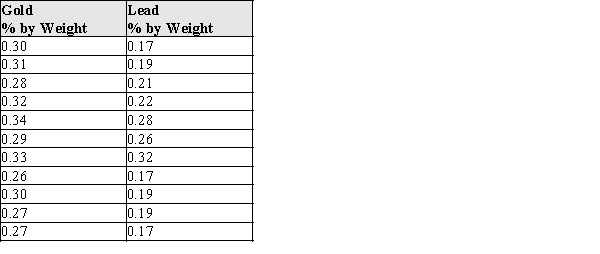
-Refer to Exhibit 4-5.
a)What is the equation of the least squares best fit line?
b)Sketch the best fit line on the scatter plot.
c)What is the value of the correlation coefficient? Interpret this value.
d)What is the value of the coefficient of determination? Give an interpretation of this value.
Definitions:
Measurement Error
The difference between the observed value and the true value of what is being measured, due to various inaccuracies in measurement processes.
Client Progress
The positive changes, developments, or improvements experienced by a client as a result of therapeutic intervention, counseling, or treatment.
Baseline Data
Information collected at the beginning of a study before any interventions are applied, used as a point of reference for assessing change.
Counseling Efficacy
The effectiveness or success of counseling interventions or practices.
Q9: Investigators recently reported the results a study
Q14: The city administration wants to find out
Q17: The marketing plan of an organization is
Q18: It is customary to say that the
Q20: What are three reasons people site for
Q27: Does including a gift with a request
Q31: A transformation, or reexpression, of a variable
Q65: Briefly describe how one would decide which
Q113: Describe the three different types of products
Q131: The market concept developed out of a