Exhibit 3-2
In 1990 the New York Times reported the average number of square feet per standing passenger in 1987 and 1988 for 19 subway stops. Although the sampling method was not reported, we will presume that these data represent a random sample of days during the morning and evening rush hours. The NYC Transit Authority managers attempted to improve the space problem on subway cars (more space is better--trust us!) by adding cars to trains during the rush hours. They gathered the 1988 data to check on their efforts after one year. The data are in the table below. 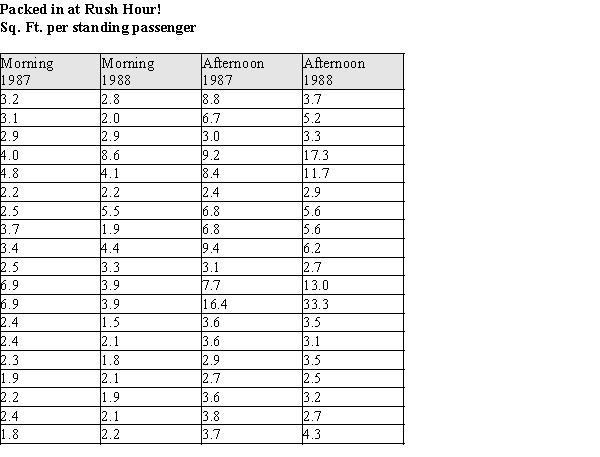
-Refer to Exhibit 3-2.
(a)Construct a comparative stem & leaf plot of the space per standing passenger for the morning rushes of 1987 vs. the morning rushes of 1988.
(b)Using your plot in part (a), describe the differences and similarities in the distributions of the morning standing room for the two years.
Definitions:
Drawings
Withdrawals of cash or other assets from a company by its owner(s) for personal use, reducing the capital account.
Economic Events
Actions or occurrences that significantly impact the financial status or operations of a business, influencing its accounting records.
Information System
An organized system for the collection, organization, storage, and communication of information; it supports data analysis and decision-making processes within an organization.
Residual Claim
A claim entitling the holder to a share of a company's income after all obligations and debts have been settled.
Q1: Which statistical parameters of the numerical data
Q1: Advocating for clients<br>A)is not within the ethical
Q18: A scatterplot showed a nonlinear relationship between
Q21: Would it be appropriate to use large
Q28: When performing tests of hypotheses, there are
Q32: Consider sampling from a skewed population. As
Q44: Customers are interested in a product's price
Q49: The likelihood that an animal will successfully
Q77: Marketing activities are:<br>A) used by all sizes
Q155: If the bond's contractual rate is 8%