Investigators studying the relation between gender and the interests of early adolescents asked boys and girls in grades 5-9 to indicate on a 7-point scale their degree of interest in topics such as Life, Sports, and Cars.
The data in the scatter plot represent average levels of interest for boys and girls in grades 5 - 9. Each point represents one topic listed by the investigators. For example, boys average rating for "Opposite sex" as a 6.2, while girls on average rated their interest in this topic as 6.0 on the 7 point interest scale. This is recorded as the point (6.2, 6.0). 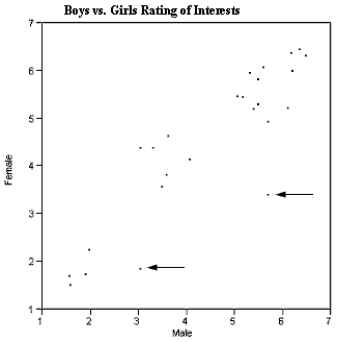 There are three interesting features of this scatter plot that you are to interpret below. What can you infer from each of these features of the scatterplot?
(a)The points generally seem to scatter around the line, y = x.
(b)There seem to be three clusters of points, one in the lower left, one in the middle, and one in the upper right of the graph.
(c)There are two points (as indicated by the arrows) that do not seem to fit the overall pattern. What can be said about the topics these points represent?
Definitions:
Poverty
The state of being extremely poor, where individuals or communities lack the financial resources to meet basic living needs.
Highest Quintile
The top 20% of a population in a distribution, typically used in referencing income or wealth distributions, representing the segment with the highest levels thereof.
Incomes
The money or other forms of payment received, typically on a regular basis, for work or through investments.
Incomes
Refers to the money received, especially on a regular basis, for work or through investments.
Q2: As every airline passenger knows, there are
Q5: When remitting GST, it is appropriate to
Q11: The marketing concept deals only with marketing
Q14: What is the black box warning on
Q17: Marketing consists primarily of selling and advertising.
Q29: A subsidiary ledger is used to<br>A) track
Q31: Interest is the payment for the use
Q42: Two events are independent if they cannot
Q42: A researcher wishes to study the relationship
Q106: When using special journals for recording and