The Iowa Tests of Educational Development are given each year to students around the country. Let x = the previous year's science scores and y = the current year's science scores for a sample of current sophomores who took the test both years.
b = estimated slope of the regression line = 0.93
a = estimated y intercept of the regression line = 30.36
a)What is the equation of the estimated regression line?
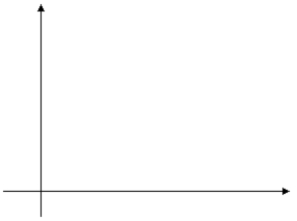
b)On the graph below, sketch the estimated regression line using the information above. Be sure to label and scale your axes correctly. 
c)For students with a score of 250 the previous year, what is the predicted score for the current year?
d)What is the average difference in science score that is associated with a 10-point difference in the previous year's science score?
e)The value of r2 is 0.71; interpret r2 in the context of this problem.
f)The value of se is 25.5. Interpret se in the context of this problem.
Definitions:
F Test
A statistical test used to determine if there are significant differences between the variances of two or more groups.
ANOVA
Analysis of Variance, a statistical method used to compare the means of three or more samples to determine if at least one of the means is significantly different from the others.
T Test
A statistical test used to determine if there is a significant difference between the means of two groups.
Independent Variable
The variable in an experiment that is manipulated to observe its effect on the dependent variable.
Q2: For a continuous random variable x, the
Q6: To estimate the proportion of faculty at
Q13: The least squares line passes through the
Q33: Refer to Exhibit 11-2. At the .05
Q35: In an analysis of hunting by African
Q37: In a few sentences, distinguish between the
Q37: If there is a negative linear relationship
Q47: A company provides portable walkie-talkies to construction
Q52: Suppose that in a certain metropolitan area
Q85: Goods exempt from PST include<br>A) children's clothing.<br>B)