Multiple Choice
The figure shows the time variation of the magnitude of the electric field of an electromagnetic wave produced by a wire antenna. 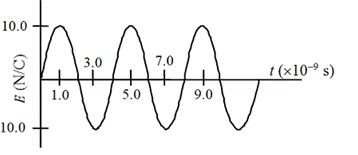
-What is the average total energy density of this electromagnetic wave?
Definitions:
Related Questions
Q4: An ac circuit consists of a series
Q5: Upon which one of the following parameters
Q7: Which fringe is the third order maximum?<br>A)A<br>B)B<br>C)C<br>D)D<br>E)E
Q13: Which fringe is the same distance from
Q20: At which of the labeled points will
Q23: Note the forces: <img src="https://d2lvgg3v3hfg70.cloudfront.net/TB3188/.jpg" alt="Note the
Q30: Radiation or(and) particles emerge(s) from a
Q53: Determine the induced emf in the loop
Q57: Complete the following statement: For the ground
Q71: A 75-W and 50-W incandescent light bulbs