 Figure 7.4
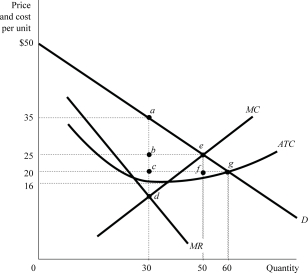
-Suppose that Figure 7.4 shows a monopolistʹs demand curve, marginal revenue, and its costs. At the profit maximizing output level, the monopolistʹs profit would be:
Definitions:
Interactions
The ways in which individuals or groups act upon and influence each other, often crucial in social and professional environments.
Design Challenge
A problem or project requiring innovative and creative solutions through design principles.
Electric Cables
Conductors used for transmitting electrical power or signals, typically composed of copper or aluminum and insulated with a protective covering.
Latent Needs
Needs that consumers are not consciously aware of but can influence their behavior and preferences.
Q4: Table 7.2 contains price, demand, and cost
Q76: A firm should shut down in the
Q146: A firmʹs short-run supply curve is its
Q170: A likely consequence over time of an
Q173: Table 7.2 contains price, demand, and cost
Q176: A constant cost industry is one in
Q204: Suppose that your firmʹs marginal cost of
Q220: Explain what guaranteed price matching means. What
Q298: Which of the following is a characteristic
Q371: Consider Figure 8.9. Choosing a low price