Figure 30-3
On the following graph, MS represents the money supply and MD represents money demand. 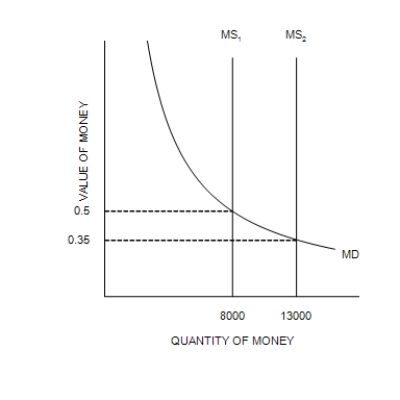
-Refer to Figure 30-3. At the end of the first year, the relevant money-supply curve was the one labeled MS2. At the end of the second year, the relevant money-supply curve was the one labeled MS1. Assuming the economy is always in equilibrium, what was the economy's approximate inflation rate for the second year?
Definitions:
Media Richness
The ability of a communication medium to effectively convey information and promote understanding, often involving the use of multiple channels like text, audio, and video.
Animation
The process of creating the illusion of motion and change by rapidly displaying a sequence of static images that minimally differ from each other.
Marketing Website
A website designed specifically for promoting and selling products or services, often including features like product descriptions, promotional materials, and purchase capabilities.
Influencer Marketing
A marketing strategy that involves endorsing products or services through influencers who have the ability to affect the purchasing decisions of others.
Q6: Explain how each of the following changes
Q60: Both foreign direct investment and foreign portfolio
Q76: Refer to Table 29-3. If the bank
Q95: In the first quarter of 2015 the
Q119: The dollar is said to appreciate against
Q122: If the U.S. real exchange rate with
Q153: The normal rate of unemployment around which
Q163: If the Fed conducts open market sales,
Q194: When you purchase school supplies at the
Q206: The money multiplier is _ when the