Figure 27-3
The following figure shows a utility function for Dexter. 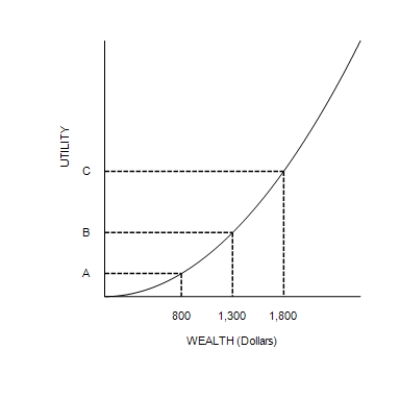
-Refer to Figure 27-3. Suppose the vertical distance between the points (0, A) and (0, B) is 12. If his wealth increased from $1,300 to $1,800, then
Definitions:
Chemists
Professionals who study chemicals and their interactions, often involved in developing new substances and analyzing compounds.
Product Departmentation
An organizational structure strategy grouping jobs and activities by specific products or product lines.
Engineers
Professionals who apply scientific and mathematical principles to solve problems and design, construct, and maintain structures, machines, and systems.
Functional Departmentation
Organizing a business into departments based on functions such as marketing, finance, or production.
Q5: Minimum wages create unemployment in markets where
Q125: Because of its vast oil reserves, Saudi
Q161: In the 1990s, several stocks had very,
Q166: Risk-averse individuals like good things more than
Q207: Public saving is equal to national saving
Q227: Suppose that some country had an adult
Q251: The Bureau of Labor Statistics produces data
Q262: If all workers and all jobs were
Q285: Most U.S. workers have wages well above
Q304: Explain the effect of right-to-work laws on