Figure 16-4
Graph (a) 
Graph (b) 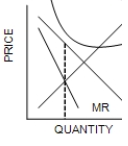
Graph (c) 
Graph (d) 
-Refer to Figure 16-4. Graph (b) is consistent with a firm in a monopolistically competitive market that is
Definitions:
Elasticity of Demand
A measure of how responsive the quantity demanded of a good is to a change in its price.
Markup
The amount added to the cost of a product by retailers to determine its selling price, representing the profit margin.
Brand-Name Markets
Markets dominated by products or services that are widely recognized and trusted by consumers due to their brand.
Restaurant Market Efficiency
Refers to the degree to which restaurant markets allocate resources optimally, balancing supply and demand effectively to meet consumer preferences.
Q35: Which of the following is true about
Q46: Refer to Table 17-9. If Alicia chooses
Q102: Refer to Scenario 18-1. What is the
Q103: If one were to consider a university
Q115: Monopolistic competition is the only market structure
Q118: Because of diminishing returns, a factor in
Q126: If advertising decreases the elasticity of demand
Q182: The socially efficient quantity is found where
Q189: When an industry has many firms, the
Q211: Critics of markets that are characterized by