Figure 8-2
The vertical distance between points C and D represents a tax in the market.
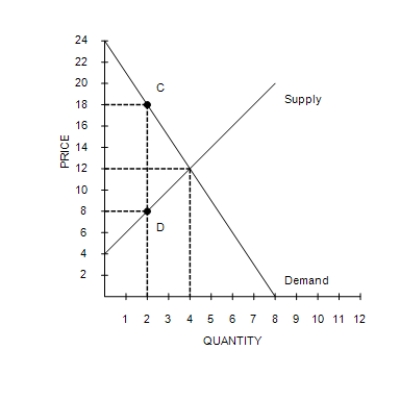
-Refer to Figure 8-2. Producer surplus without the tax is
Definitions:
Linear Demand
A market demand situation where a product's price and the quantity demanded have a linear relationship.
Curve
In economics, it typically refers to a graphical representation showing the relationship between two variables.
Cross Elasticity
The responsiveness of the demand for one good to a change in the price of another good.
Coefficient
A numerical or constant quantity placed before and multiplying the variable in an algebraic expression.
Q56: When a country that imports a particular
Q101: Refer to Figure 7-14. Suppose there is
Q120: Refer to Scenario 9-1. Suppose the world
Q130: The presence of a price control in
Q142: Suppose a tax is imposed on producers
Q148: The distinction between efficiency and equality can
Q152: Producing a soccer ball costs Jake $5.
Q193: Refer to Figure 6-18. If the government
Q217: Refer to Figure 7-9. If the price
Q218: Taxes levied on sellers and taxes levied