Figure 8-8
Graph (a) 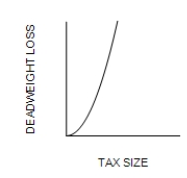
Graph (b) 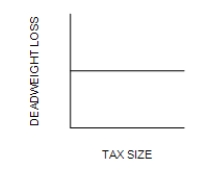
Graph (c) 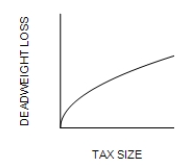
-Refer to Figure 8-8. Which graph correctly illustrates the relationship between the size of a tax and the size of the deadweight loss associated with the tax?
Definitions:
Longevity
The length of time that an individual lives or a thing exists, often referring to a life span exceeding the average.
Genetic Traits
Hereditary characteristics passed from parents to offspring through genes, such as eye color, blood type, and susceptibility to certain diseases.
Marital Stability
The condition of a marriage being consistently healthy, functional, and free from significant conflict over time.
Higher Education
Education provided by universities and colleges, typically following completion of secondary education and leading to the award of degrees at different levels.
Q3: A tax on golf clubs will cause
Q10: Policymakers often consider trade restrictions in order
Q57: When the nation of Duxembourg allows trade
Q68: Refer to Figure 8-9. Suppose the government
Q106: If the government removes a tax on
Q157: If a tax is imposed on the
Q179: Studies by economists have found that a
Q187: If the size of a tax increases,
Q285: If the supply curve is more price
Q287: The primary effect of rent control in