Figure 8-5
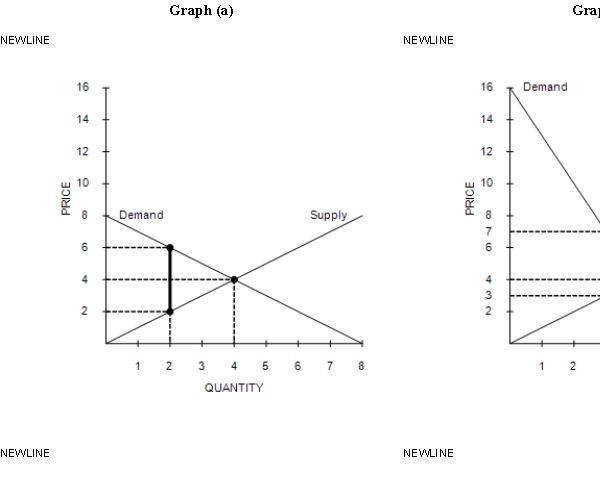
-Refer to Figure 8-5. Graph (a) and Graph (b) each illustrate a $4 tax placed on a market. In comparison to Graph (a) , Graph (b) illustrates which of the following statements?
Definitions:
X-inefficiency
The difference between efficient behavior of businesses under competitive environments versus the inefficiency that arises in the absence of competition.
Competitive Firms
Companies that operate in markets where no single firm has the power to influence the price of goods and services significantly.
Monopolistic Firms
Companies that have significant control over the market for a particular good or service, allowing them to influence price and production levels.
Economic Inefficiency
A situation where resources are not used in the most productive way, often leading to waste or a loss of potential output.
Q68: Refer to Figure 6-20. Suppose a $4
Q71: Refer to Figure 8-10. How much is
Q83: Refer to Scenario 7-2. How much is
Q87: Suppose that Australia imposes a tariff on
Q128: The idea that tax cuts would increase
Q129: Total surplus in a market can be
Q145: Refer to Figure 10-1. This graph represents
Q152: Producing a soccer ball costs Jake $5.
Q187: Refer to Scenario 7-1. If the market
Q188: Refer to Scenario 7-2. Suppose a