Multiple Choice
Figure 6-1
Graph (a)
Graph (b)
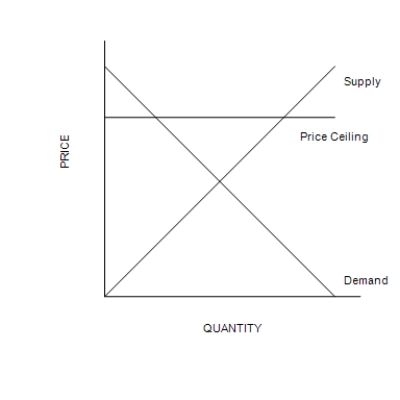
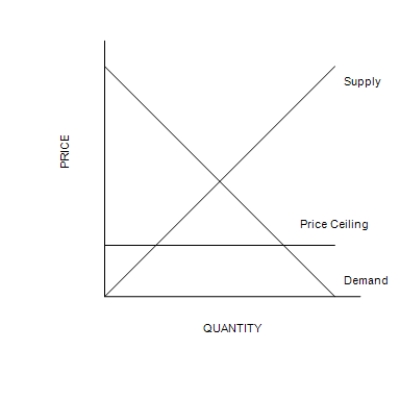
-Refer to Figure 6-1. The price ceiling shown in graph (a)
Definitions:
Related Questions
Q2: Refer to Table 7-11. Both the demand
Q14: Refer to Figure 6-9. In this market,
Q38: Refer to Scenario 5-6. Using the midpoint
Q54: Refer to Figure 7-4. When the price
Q113: Suppose the demand for calendars increases in
Q154: Pizza is a normal good if the
Q161: Refer to Figure 5-4. Total revenue when
Q188: You receive a paycheck from your employer,
Q221: Necessities tend to have elastic demands, whereas
Q243: If the demand for a good falls