Multiple Choice
Figure 1 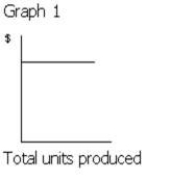
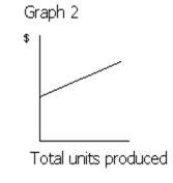
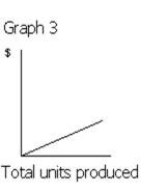
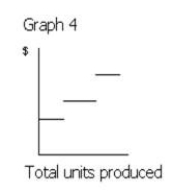
-Which of the following graphs in Figure 1 illustrates the behavior of a total variable cost?
Definitions:
Related Questions
Q11: The total direct labor variance is<br>A)$2,051.25 favorable<br>B)$2,051.25
Q19: Advertising costs of $12,000 per month<br>A)Variable cost<br>B)Fixed
Q32: The direct labor time variance is the
Q39: Property tax expense is an example of
Q50: Piper Technology's fixed costs are $1,500,000, the
Q66: A support department provides a necessary service
Q82: The major categories or captions that would
Q97: Actual cost < standard cost at actual
Q130: EBITDA removes a significant fixed and noncash
Q145: The goal of using any overhead rate