Short Answer
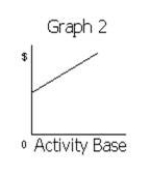
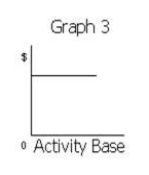
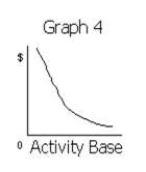
Match each of the following costs with the graph (a-e) that best portrays its cost behavior as the number of units produced and sold increases. 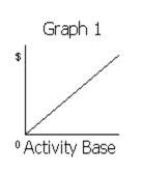
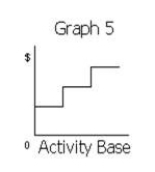
-Total employer pension costs of $0.35 per direct labor hour
A)Graph 1
B)Graph 2
C)Graph 3
D)Graph 4
E)Graph 5
Definitions:
Related Questions
Q11: Atlantic Company sells a product with a
Q14: As of January 1 of the current
Q41: Based on the following production and sales
Q45: The financial budgets of a business include
Q45: Support department costs are normally accounted for
Q77: When Isaiah Company has fixed costs of
Q79: If a business had a capacity of
Q112: A major drawback to using a single
Q131: Service firms can only have one activity
Q220: If fixed costs increased and variable costs