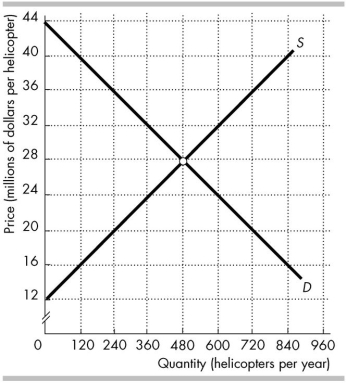
 The figure above shows the market for helicopters in the United States, where D is the domestic demand curve and S is the domestic supply curve. The United States trades helicopters with the rest of the world at a price of $36 million per helicopter.
-In the figure above, the United States _______ helicopters per year.
Definitions:
Average Total Costs
The total costs of production (fixed and variable costs) divided by the number of units produced, showing the cost per unit.
Pure Monopoly
A market structure in which a single seller controls the entire supply of a product or service, and therefore can manipulate prices and conditions of sale.
Close Substitutes
Products or services that are so similar that a consumer can easily replace one with another, often affecting consumer choice and market competition.
Sole Producer
A market situation where only one supplier exists for a particular good or service, often leading to monopolistic behaviour.
Q21: Consider the demand curves for soft drinks
Q54: A 10 per cent increase in income
Q70: Suppose a rise in the price of
Q70: Taxes can yield the efficient level of
Q91: If a price hike of 5 per
Q99: Australia imports cars from Japan. If Australia
Q107: Consider a market in which there is
Q108: When a good is made illegal, which
Q122: If a 10 per cent increase in
Q129: Bicycles are made out of steel. If