Multiple Choice
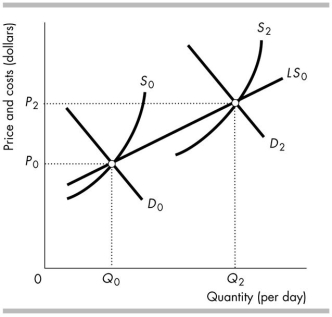
-The curve LS0 in the above figure is the long- run supply curve in a perfectly competitive market. The short- run market supply curve shifts from S0 to S2 as the
Definitions:
Related Questions
Q1: In the above table, the production of
Q25: A strategy called "limit pricing" sets the
Q26: Measured wealth is a less accurate indicator
Q38: A firm's opportunity costs _.<br>A) increase when
Q39: The opportunity cost of leisure is<br>A) a
Q52: A income tax system in which the
Q71: Pointy Stone State Park is the sole
Q87: An advertising campaign that successfully convinces consumers
Q101: In the short run, a perfectly competitive
Q139: Alice, Bob and Cody live in Wesland.